The goal of this notebook is to code a decision tree classifier/regressor that can be used with the following API:
df = pd.read_csv("data.csv")

train_df, test_df = train_test_split(df, test_size=0.2)
tree = decision_tree_algorithm(train_df, ml_task="regression")
accuracy = calculate_accuracy(test_df, tree)
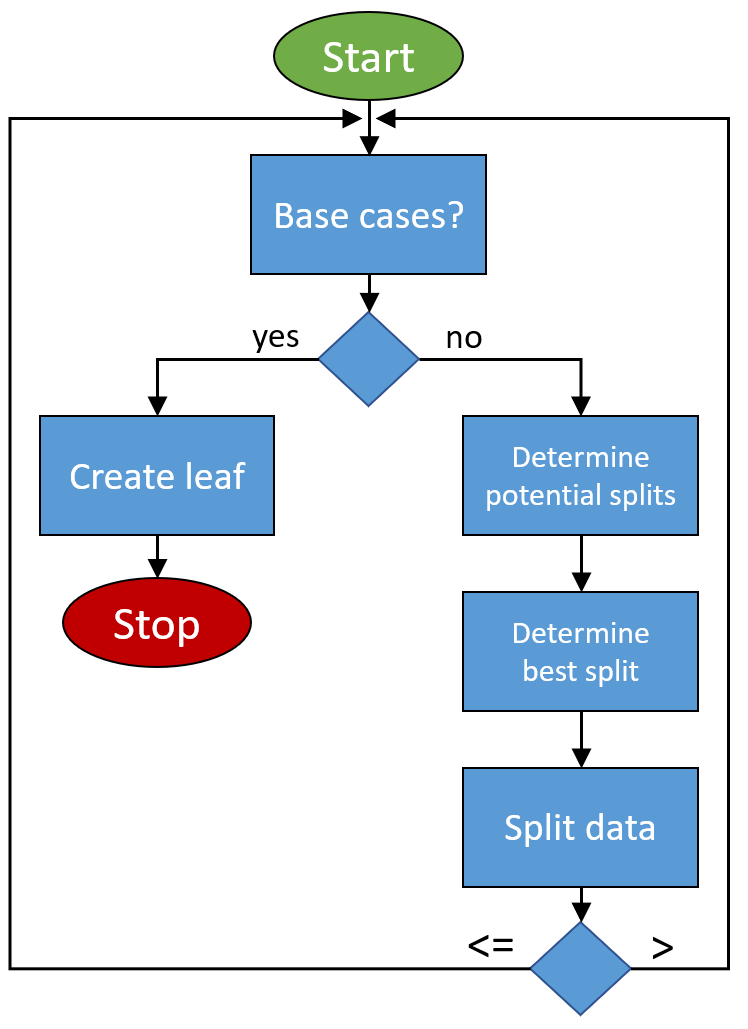
The algorithm that is going to be implemented looks like this:
Import Statements
In [1]:
import numpy as np
import pandas as pd

import matplotlib.pyplot as plt
import seaborn as sns

import random
from pprint import pprint
In [2]:
%matplotlib inline
sns.set_style("darkgrid")
Load and Prepare Data
Format of the data
- the last column of the data frame must contain the label and it must also be called "label"
- there should be no missing values in the data frame
In [3]:
df = pd.read_csv("../data/Bike.csv", parse_dates=["dteday"])
df = df.drop(["instant", "casual", "registered"], axis=1)
df = df.rename({"dteday": "date"}, axis=1)
In [4]:
df.head()
Out[4]:
In [5]:
date_column = df.date

df["day_of_year"] = date_column.dt.dayofyear
df["day_of_month"] = date_column.dt.day

df["quarter"] = date_column.dt.quarter
df["week"] = date_column.dt.week

df["is_month_end"] = date_column.dt.is_month_end
df["is_month_start"] = date_column.dt.is_month_start
df["is_quarter_end"] = date_column.dt.is_quarter_end
df["is_quarter_start"] = date_column.dt.is_quarter_start
df["is_year_end"] = date_column.dt.is_year_end
df["is_year_start"] = date_column.dt.is_year_start

df = df.set_index("date")
In [6]:
df["label"] = df.cnt
df = df.drop("cnt", axis=1)
In [7]:
df.head()
Out[7]:
Train-Val-Test-Split
In [8]:
train_df = df.iloc[:-122]
val_df = df.iloc[-122:-61]  # Sep and Oct of 2012
test_df = df.iloc[-61:]     # Nov and Dec of 2012
Helper Functions
The helper functions operate on a NumPy 2d-array. Therefore, let’s create a variable called “data” to see what we will be working with.
In [9]:
data = train_df.values[:5]
data
Out[9]:
Data pure?
In [10]:
def check_purity(data):

    label_column = data[:, -1]
    unique_classes = np.unique(label_column)

    if len(unique_classes) == 1:
        return True
    else:
        return False
Create Leaf
In [11]:
def create_leaf(data, ml_task):

    label_column = data[:, -1]
    if ml_task == "regression":
        leaf = np.mean(label_column)

    # classfication
    else:
        unique_classes, counts_unique_classes = np.unique(label_column, return_counts=True)
        index = counts_unique_classes.argmax()
        leaf = unique_classes[index]

    return leaf
Potential splits?
In [12]:
def get_potential_splits(data):

    potential_splits = {}
    _, n_columns = data.shape
    for column_index in range(n_columns - 1):          # excluding the last column which is the label
        values = data[:, column_index]
        unique_values = np.unique(values)

        potential_splits[column_index] = unique_values

    return potential_splits
Split Data
In [13]:
def split_data(data, split_column, split_value):

    split_column_values = data[:, split_column]

    type_of_feature = FEATURE_TYPES[split_column]
    if type_of_feature == "continuous":
        data_below = data[split_column_values <= split_value]
        data_above = data[split_column_values >  split_value]

    # feature is categorical
    else:
        data_below = data[split_column_values == split_value]
        data_above = data[split_column_values != split_value]

    return data_below, data_above
Determine Best Split
In [14]:
def calculate_mse(data):
    actual_values = data[:, -1]
    if len(actual_values) == 0:   # empty data
        mse = 0

    else:
        prediction = np.mean(actual_values)
        mse = np.mean((actual_values - prediction) **2)

    return mse
In [15]:
def calculate_entropy(data):

    label_column = data[:, -1]
    _, counts = np.unique(label_column, return_counts=True)

    probabilities = counts / counts.sum()
    entropy = sum(probabilities * -np.log2(probabilities))

    return entropy
In [16]:
def calculate_overall_metric(data_below, data_above, metric_function):

    n = len(data_below) + len(data_above)
    p_data_below = len(data_below) / n
    p_data_above = len(data_above) / n

    overall_metric =  (p_data_below * metric_function(data_below)
                     + p_data_above * metric_function(data_above))

    return overall_metric
In [17]:
def determine_best_split(data, potential_splits, ml_task):

    first_iteration = True
    for column_index in potential_splits:
        for value in potential_splits[column_index]:
            data_below, data_above = split_data(data, split_column=column_index, split_value=value)

            if ml_task == "regression":
                current_overall_metric = calculate_overall_metric(data_below, data_above, metric_function=calculate_mse)

            # classification
            else:
                current_overall_metric = calculate_overall_metric(data_below, data_above, metric_function=calculate_entropy)

            if first_iteration or current_overall_metric <= best_overall_metric:
                first_iteration = False

                best_overall_metric = current_overall_metric
                best_split_column = column_index
                best_split_value = value

    return best_split_column, best_split_value
Decision Tree Algorithm
Representation of the Decision Tree
In [18]:
sub_tree = {"question": ["yes_answer",
                         "no_answer"]}
In [19]:
example_tree = {"petal_width <= 0.8": ["Iris-setosa",
                                      {"petal_width <= 1.65": [{"petal_length <= 4.9": ["Iris-versicolor",
                                                                                        "Iris-virginica"]},
                                                                "Iris-virginica"]}]}
Determine Type of Feature
In [20]:
def determine_type_of_feature(df):

    feature_types = []
    n_unique_values_treshold = 15
    for feature in df.columns:
        if feature != "label":
            unique_values = df[feature].unique()
            example_value = unique_values[0]

            if (isinstance(example_value, str)) or (len(unique_values) <= n_unique_values_treshold):
                feature_types.append("categorical")
            else:
                feature_types.append("continuous")

    return feature_types
Algorithm
In [21]:
def decision_tree_algorithm(df, ml_task, counter=0, min_samples=2, max_depth=5):

    # data preparations
    if counter == 0:
        global COLUMN_HEADERS, FEATURE_TYPES
        COLUMN_HEADERS = df.columns
        FEATURE_TYPES = determine_type_of_feature(df)
        data = df.values
    else:
        data = df


    # base cases
    if (check_purity(data)) or (len(data) < min_samples) or (counter == max_depth):
        leaf = create_leaf(data, ml_task)
        return leaf


    # recursive part
    else:
        counter += 1

        # helper functions
        potential_splits = get_potential_splits(data)
        split_column, split_value = determine_best_split(data, potential_splits, ml_task)
        data_below, data_above = split_data(data, split_column, split_value)

        # check for empty data
        if len(data_below) == 0 or len(data_above) == 0:
            leaf = create_leaf(data, ml_task)
            return leaf

        # determine question
        feature_name = COLUMN_HEADERS[split_column]
        type_of_feature = FEATURE_TYPES[split_column]
        if type_of_feature == "continuous":
            question = "{} <= {}".format(feature_name, split_value)

        # feature is categorical
        else:
            question = "{} = {}".format(feature_name, split_value)

        # instantiate sub-tree
        sub_tree = {question: []}

        # find answers (recursion)
        yes_answer = decision_tree_algorithm(data_below, ml_task, counter, min_samples, max_depth)
        no_answer = decision_tree_algorithm(data_above, ml_task, counter, min_samples, max_depth)

        # If the answers are the same, then there is no point in asking the qestion.
        # This could happen when the data is classified even though it is not pure
        # yet (min_samples or max_depth base case).
        if yes_answer == no_answer:
            sub_tree = yes_answer
        else:
            sub_tree[question].append(yes_answer)
            sub_tree[question].append(no_answer)

        return sub_tree
In [22]:
tree = decision_tree_algorithm(train_df, ml_task="regression", max_depth=3)
pprint(tree)
Prediction
In [23]:
sub_tree
Out[23]:
In [24]:
example = test_df.iloc[0]
example
Out[24]:
In [25]:
def predict_example(example, tree):
    question = list(tree.keys())[0]
    feature_name, comparison_operator, value = question.split(" ")

    # ask question
    if comparison_operator == "<=":
        if example[feature_name] <= float(value):
            answer = tree[question][0]
        else:
            answer = tree[question][1]

    # feature is categorical
    else:
        if str(example[feature_name]) == value:
            answer = tree[question][0]
        else:
            answer = tree[question][1]

    # base case
    if not isinstance(answer, dict):
        return answer

    # recursive part
    else:
        residual_tree = answer
        return predict_example(example, residual_tree)
In [26]:
predict_example(example, tree)
Out[26]:
Hyperparameter Tuning
In [27]:
def calculate_r_squared(df, tree):
    labels = df.label
    mean = labels.mean()
    predictions = df.apply(predict_example, args=(tree,), axis=1)

    ss_res = sum((labels - predictions) ** 2)
    ss_tot = sum((labels - mean) ** 2)
    r_squared = 1 - ss_res / ss_tot

    return r_squared
The following cell takes some time to run!!!
In [28]:
grid_search = {"max_depth": [], "min_samples": [], "r_squared_train": [], "r_squared_val": []}
for max_depth in range(1, 7):
    for min_samples in range(5, 20, 5):
        tree = decision_tree_algorithm(train_df, ml_task="regression", max_depth=max_depth, min_samples=min_samples)

        r_squared_train = calculate_r_squared(train_df, tree)
        r_squared_val = calculate_r_squared(val_df, tree)

        grid_search["max_depth"].append(max_depth)
        grid_search["min_samples"].append(min_samples)
        grid_search["r_squared_train"].append(r_squared_train)
        grid_search["r_squared_val"].append(r_squared_val)

    print(f"Progress: Iteration {max_depth}/6")

grid_search = pd.DataFrame(grid_search)
grid_search.sort_values("r_squared_val", ascending=False).head()
Out[28]:
Visualization
In [29]:
best_max_depth = 6
best_min_samples = 15

tree = decision_tree_algorithm(train_df, ml_task="regression", max_depth=best_max_depth, min_samples=best_min_samples)
calculate_r_squared(test_df, tree)
Out[29]:
In [30]:
def create_plot(df, tree, title):
    predictions = df.apply(predict_example, args=(tree,), axis=1)
    actual = df.label
    plot_df = pd.DataFrame({"actual": actual, "predictions": predictions})

    plot_df.plot(figsize=(18, 5), title=title)

    return
In [31]:
create_plot(train_df, tree, title="Training Data")

In [32]:
create_plot(train_df, tree, title="Training Data")
plt.xlim(pd.to_datetime("2011-01-01"), pd.to_datetime("2011-02-28"));

In [33]:
create_plot(val_df, tree, title="Validation Data")

In [34]:
create_plot(test_df, tree, title="Test Data")

Classification Task
In [35]:
df = pd.read_csv("../data/Iris.csv")
df = df.drop("Id", axis=1)
df = df.rename(columns={"species": "label"})
In [36]:
df.head()
Out[36]:
In [37]:
def train_test_split(df, test_size):

    if isinstance(test_size, float):
        test_size = round(test_size * len(df))

    indices = df.index.tolist()
    test_indices = random.sample(population=indices, k=test_size)

    test_df = df.loc[test_indices]
    train_df = df.drop(test_indices)

    return train_df, test_df
In [38]:
random.seed(0)
train_df, test_df = train_test_split(df, test_size=20)
In [39]:
tree = decision_tree_algorithm(train_df, ml_task="classification", max_depth=3)
pprint(tree)
In [40]:
def calculate_accuracy(df, tree):

    df["classification"] = df.apply(predict_example, args=(tree,), axis=1)
    df["classification_correct"] = df["classification"] == df["label"]

    accuracy = df["classification_correct"].mean()

    return accuracy
In [41]:
accuracy = calculate_accuracy(test_df, tree)
accuracy
Out[41]:
In [ ]: